 Filter: Categories of Wisconsin Historical Images
Filter: Subject of Rivers
Filter: Creator Name of Lapham, Increase Allen
Filter: Subject of great lakes
Filter: Categories of Wisconsin Historical Images
Filter: Subject of Rivers
Filter: Creator Name of Lapham, Increase Allen
Filter: Subject of great lakes
| Date: | 1865 |
|---|---|
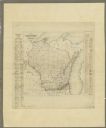
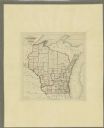
| Description: | This map shows county boundaries, outlined in red. Each county's population is handwritten in the margins. The map also includes towns, rivers and lakes. |
| Date: | 1866 |
|---|---|
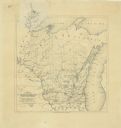
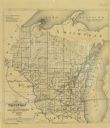
| Description: | This thematic shows the effects that Lake Michigan has had on Wisconsin mean temperatures in January and July. The map shows counties, some cities, rivers ... |
| Date: | 1865 |
|---|---|
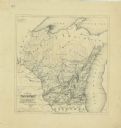
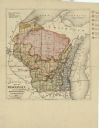
| Description: | This map shows the population density per square mile in the entire state, showing southeastern and southern Wisconsin had the greatest population density ... |
| Date: | 1865 |
|---|---|
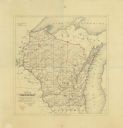
| Description: | Drawn the last year of the Civil War, this thematic map shows the effects that Lake Michigan has had on Wisconsin temperatures in January and July. The map... |
| Date: | 1867 |
|---|---|
| Description: | Map of the entire state indicates county boundaries outlined in red, cities of over 3000 inhabitants and county seats. It also marks rivers and lakes. |
| Date: | 1868 |
|---|---|
| Description: | Prepared for the State Board of Emigration in 1868, this map shows county boundaries, some cities, and completed and projected railroads. |
| Date: | 1873 |
|---|---|
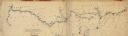
| Description: | A hand-colored, geological map of the Fox and Wisconsin rivers’ water path from the Mississippi River to the Great Lakes. The map also shows those railroad... |
| Date: | 1874 |
|---|---|
| Description: | This map of Wisconsin shows cities, counties, railroads already completed and railroads projected, and geological makeup of the land such as lakes. |
If you didn't find the material you searched for, our Library Reference Staff can help.
Call our reference desk at 608-264-6535 or email us at: