 Filter: Categories of Wisconsin Historical Images
Filter: FULL_DATE of 1865
Filter: Subject of cities and towns
Filter: Subject of lakes
Filter: Categories of Wisconsin Historical Images
Filter: FULL_DATE of 1865
Filter: Subject of cities and towns
Filter: Subject of lakes
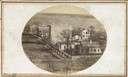
| Date: | 1865 |
|---|---|
| Description: | South Wisconsin Avenue and West Main Street. Lake Monona is in the background and the Lucius Fairchild and David Atwood houses are at the upper left. The r... |
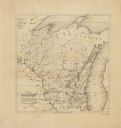
| Date: | 1865 |
|---|---|
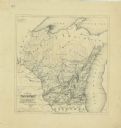
| Description: | Map showing the location of meteorological stations and effects that Lake Michigan has had on Wisconsin temperatures in January and July. The map shows cou... |
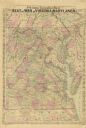
| Date: | 1865 |
|---|---|
| Description: | A general map of eastern Virginia, Maryland, Delaware, southern Pennsylvania, and northern North Carolina. |
| Date: | 1865 |
|---|---|
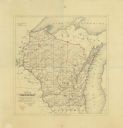
| Description: | This map shows county boundaries, outlined in red. Each county's population is handwritten in the margins. The map also includes towns, rivers and lakes. |
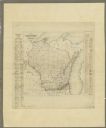
| Date: | 1865 |
|---|---|
| Description: | This map shows the population density per square mile in the entire state, showing southeastern and southern Wisconsin had the greatest population density ... |
| Date: | 1865 |
|---|---|
| Description: | Drawn the last year of the Civil War, this thematic map shows the effects that Lake Michigan has had on Wisconsin temperatures in January and July. The map... |
| Date: | 1865 |
|---|---|
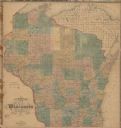
| Description: | This map of the entire state of Wisconsin depicts the township survey grid and identifies counties, named towns, cities and villages, rivers, lakes, railro... |
If you didn't find the material you searched for, our Library Reference Staff can help.
Call our reference desk at 608-264-6535 or email us at: